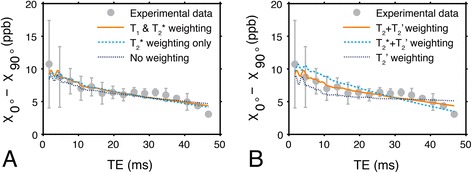
Fig. 9.

Comparison between susceptibility anisotropy data simulated under different signal models. a Experimental susceptibility anisotropy and simulated susceptibility anisotropy data when the model includes T1 and T2*-weighting, T2*-weighting only, and no weighting in both the intra- and extracellular signal compartments. The simulated anisotropy is minimally affected by excluding multi-compartment relaxation effects from the model. b Experimental data from the specimen and simulated data from a model demonstrating the effect of superposing T2, T2*, and no additional weighting on top of the inherent intracellular T2’ that exists due to the field inhomogeneity produced by the simulated peptide bonds. The additional intracellular spin-spin relaxation weighting significantly impacts susceptibility anisotropy as a function of TE, and is most correct in the model simulating T2’ superposed with T2. Error bars indicate the standard deviation of the experimental data
