FIGURE 2—

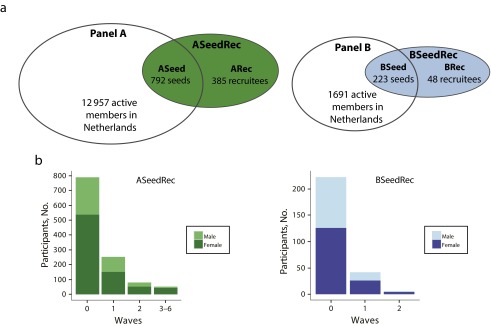
Overview of the sample composition by (a) participatory surveillance panels, seeds, and recruits taking part in the study, and (b) number of participants by wave and gender: The Netherlands, 2013–2014 influenza season.

Overview of the sample composition by (a) participatory surveillance panels, seeds, and recruits taking part in the study, and (b) number of participants by wave and gender: The Netherlands, 2013–2014 influenza season.