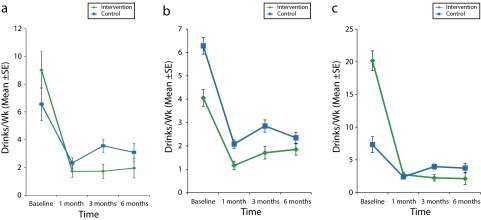
FIGURE 1—

Estimated marginal mean number of drinks consumed per week over time and by treatment group for (a) all women, (b) nondepressed women, and (c) depressed women: Southern California, 2011–2013.
Note. Groups were compared with repeated-measures analysis of variance with imputed data (n = 123; control group, n = 67; intervention group, n = 56). For the total sample and the not depressed group, time effect P < .001; intervention effect, not significant (P = .127 and .365). For the depressed group, time effect P < .001; intervention effect P < .001. Whiskers indicate standard errors.
