
Figure 5.
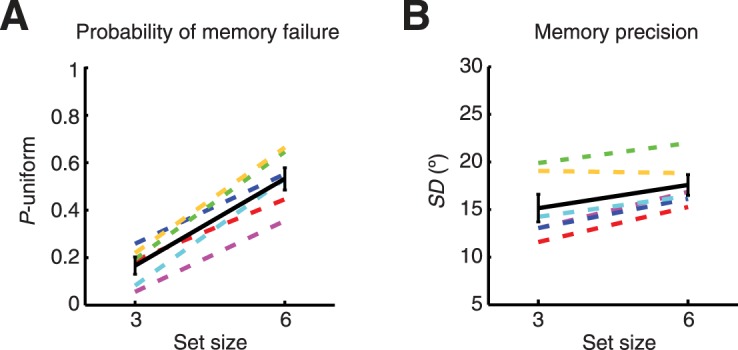
Comparison of working memory performance for set sizes 3 and 6. (A) Estimated probability of memory failure (P-uniform) for set sizes 3 and 6, for data pooled across all confidence levels. Individual data plotted with dashed colored lines; group average in solid black. (B) Estimated precision of memory (SD) for set sizes 3 and 6.