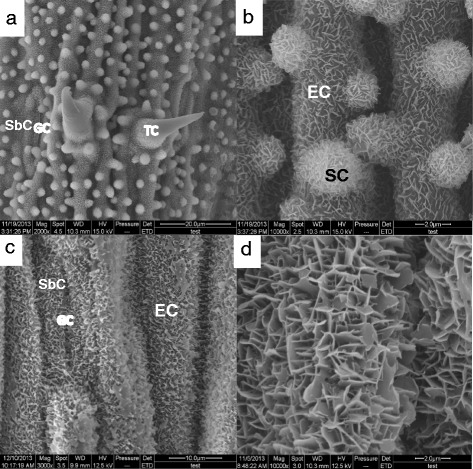
Fig. 1.

ESEM visualization of the epicuticular rice surfaces under the normal conditions. a Rice leaf epicuticular surface containing epidermis (EC), guard cell (GC), silica cell (SC), subsidiary cell (SbC), and trichome (TC). Bar = 20 μm. b Magnified ESEM image of rice leaf to visualize the crystalline wax platelet networks on the epicuticular surfaces. Bar = 2 μm. c P. tenuiflora leaf epidermis. Bar = 10 μm. d Magnified ESEM image of P. tenuiflora leaf surface. Bar = 2 μm
