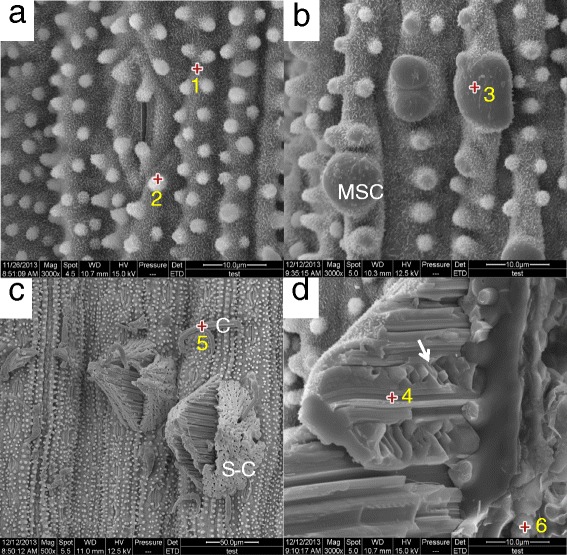
Fig. 2.

ESEM photographs of rice epicuticular surfaces; (a) under no NaHCO3 stress. Bar = 10 μm. b Under 100 mM NaHCO3 for 5 days exposure. Bar = 10 μm. Merged/enlarged silica cells (MSCs) were newly formed. c Under 100 mM NaHCO3 stress for 7 days exposure. Bar = 50 μm. Swollen corn-shapes (S-Cs) and columns (Cs) appeared. d Magnified ESEM image of cross-section of a swollen corn-shape Under 200 mM NaHCO3 stress for 5 days exposure. Bar = 10 μm. S-C. Cubic crystals appeared as marked arrow. The marked numbers are the spots for EDX microanalysis
