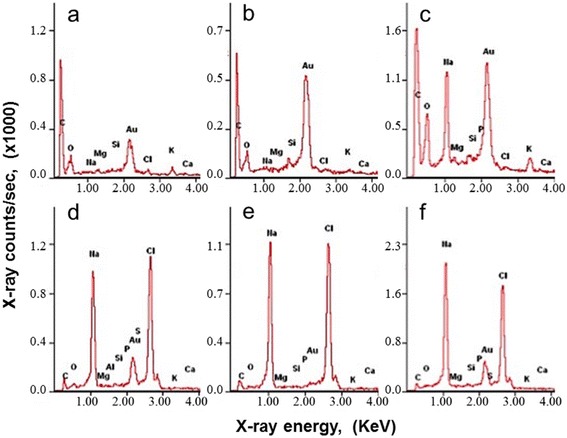
Fig. 3.

EDX microanalysis spectra of rice leaves. The spectra obtained from; (a) EC under no NaHCO3 stress (#1 spot in Fig. 2a), (b) SC under no NaHCO3 stress (#2 spot in Fig. 2a), (c) MSC under 100 mM NaHCO3 for 5 days exposure (#3 spot in Fig. 2b), (d) S-C under 200 mM NaHCO3 for 5 days exposure (#4 spot in Fig. 2d), (e) C under 100 mM NaHCO3 for 7 days exposure (#5 spot in Fig. 2c), and (f) The solidified particles underneath of the cell wall under 200 mM NaHCO3 for 5 days exposure (#6 spot in Fig. 2d)
