Fig. 6.

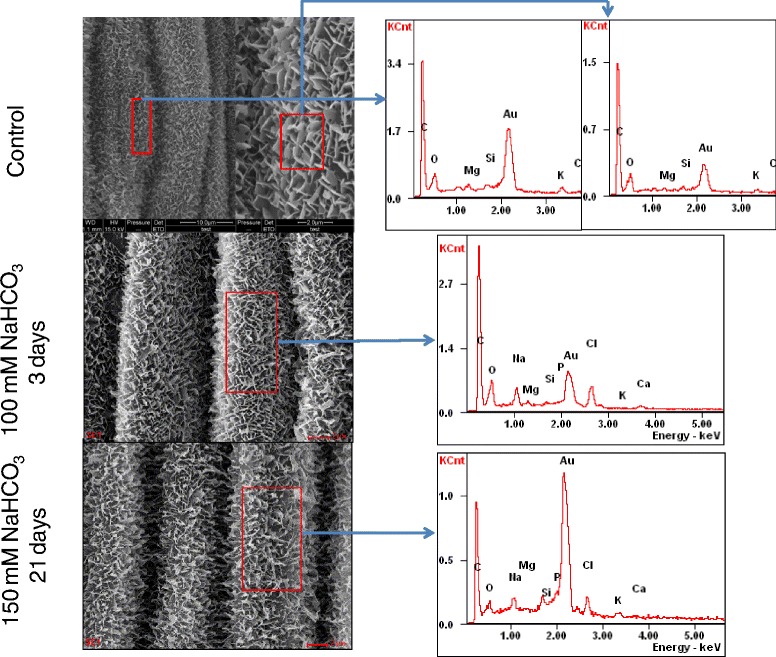
ESEM images of p. tenuiflora leaf surface experienced with 0 mM, 100 mM NaHCO3 for 3 days, and 150 mM NaHCO3 for 21 days. EDX spectra over the different spots (marked box on ESEM images) showed no significant changes

ESEM images of p. tenuiflora leaf surface experienced with 0 mM, 100 mM NaHCO3 for 3 days, and 150 mM NaHCO3 for 21 days. EDX spectra over the different spots (marked box on ESEM images) showed no significant changes