Figure 4.

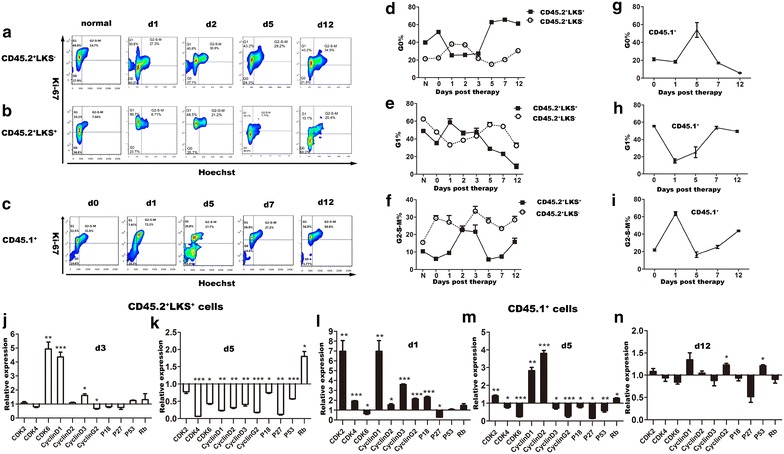
Primitive hematopoietic cells showed a dramatic cell-cycle activation after therapy ahead of leukemic cells. Cell cycle status of primitive hematopoietic cells and leukemic cells in the BM post therapy was analyzed by Ki-67 and Hoechst staining on flow cytometry. CD45.2+LK+S+ cells and leukemic cells post therapy were sorted and the expression patterns of cell-cycle related genes in these cells were examined. CD45.2+LK+S+ cells from normal control and leukemic cells sorted from leukemia-only mice were used as control for either cell type, respectively. a Representative flow cytometry plots of cell-cycle of CD45.2+LK+S− cells in the BM of normal control and the 1-day treated leukemic mice on different days as indicated. b Representative flow cytometry plots of cell-cycle of CD45.2+LK+S+ cells in the BM of normal control and the 1-day treated leukemic mice on different days. c Representative flow cytometry plots of cell-cycle of leukemic cells in the BM of the 1-day treated leukemic mice on different days. d–f Cell-cycle status of CD45.2+LK+S− and CD45.2+LK+S+ cells in the BM of normal control and the 1-day treated leukemic mice on different days (n = 3–7). g–i Cell-cycle status of leukemic cells in the BM of the 1-day treated leukemic mice on different days (n = 4–8). j–k Gene expression patterns of CD45.2+LK+S+ cells in the BM of normal control and the 1-day treated leukemic mice on the 3rd and 5th day post therapy. l–n Gene expression patterns of leukemic cells in the BM of the leukemia-only and the 1-day treated leukemic mice on the 1st, 5th, and 12th day post therapy. All data were presented as mean ± SEM. Statistical significance determined as: *p < 0.05; **p < 0.01; ***p < 0.001.
