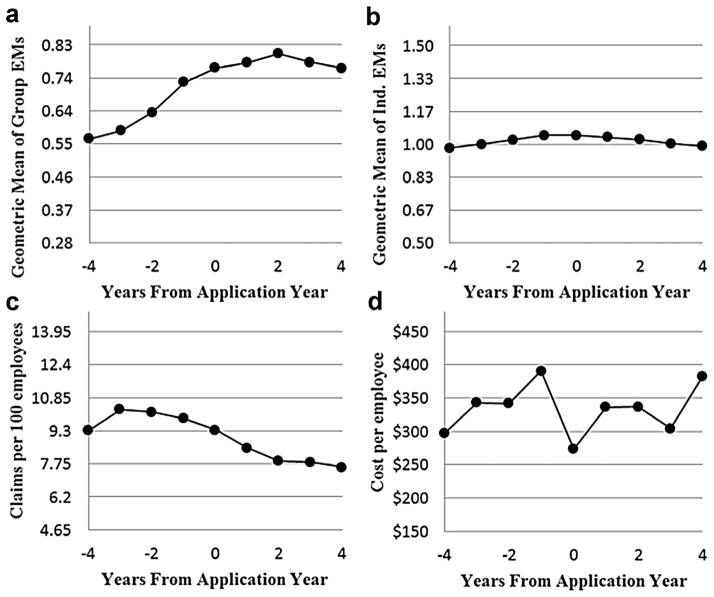
FIGURE 2.
(a) Geometric Mean of the Group EMs by year from application* (b) Geometric Mean of the Individual EMs by year from application** (c) Claim rate per 100 employees for the entire employer by year from application and (d) Total paid claim cost per employee for the entire employer by year from application. General note for entire table (a, b, c, d): Data in all four panels were classified into years preceding application and following grant implementation, with year 0 representing a mixture of pre and/or post period and the period between application and grant implementation. See the Methods section. Note for (a) *EMs used for calculation of premium. If employer participates in a group plan with other employers, the Group EM is used. Note for (b) **EMs based only on individual employer claims experience.

