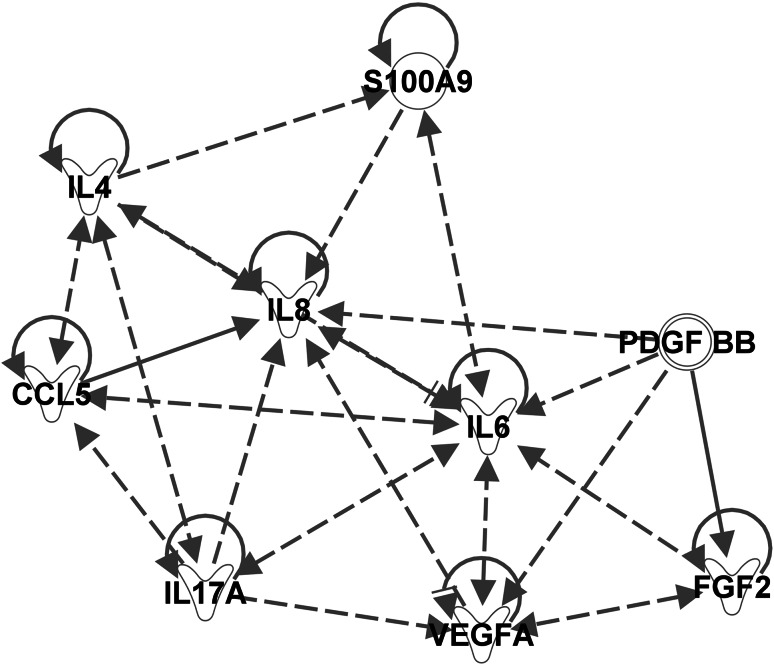
Fig. 2.
Pathway analysis of cytokines determined to be up-regulated in plasma collected from pancreatic adenocarcinoma patients. The pathway map was generated by adding the cytokines increased in the plasma of untreated pancreatic adenocarcinoma and those cytokines that were found to be increased in chemotherapy-treated pancreatic adenocarcinoma versus chemonaive into a new pathway map in IPA and have IPA determine the relationships. S100A9 was then added to the map given the importance of S100A9 in the myeloid chemotaxis pathway, and IPA was utilized to predict the relationships between the cytokines and S100A9. IL-6 is a central regulator of MDSC biology and pathway analysis using Ingenuity Pathway Analysis software confirmed this finding. In addition, the protein S100A9, although not part of the BioPlex® analysis, appears to be important in signaling in pancreatic adenocarcinoma patients. Dashed line arrows signify indirect relationships. Solid lines with arrows represent direct relationships. A solid line parallel to the arrow signifies inhibition. Proteins that regulate themselves have a solid line pointed to themselves (e.g., S100A9, IL-4, CCL5 (RANTES), IL-6). The proteins have different shapes based on their categorization in IPA. Cytokines have a Y shape. S100A9 and PDGF-BB are not placed in any one particular group which is why they have circular shapes

