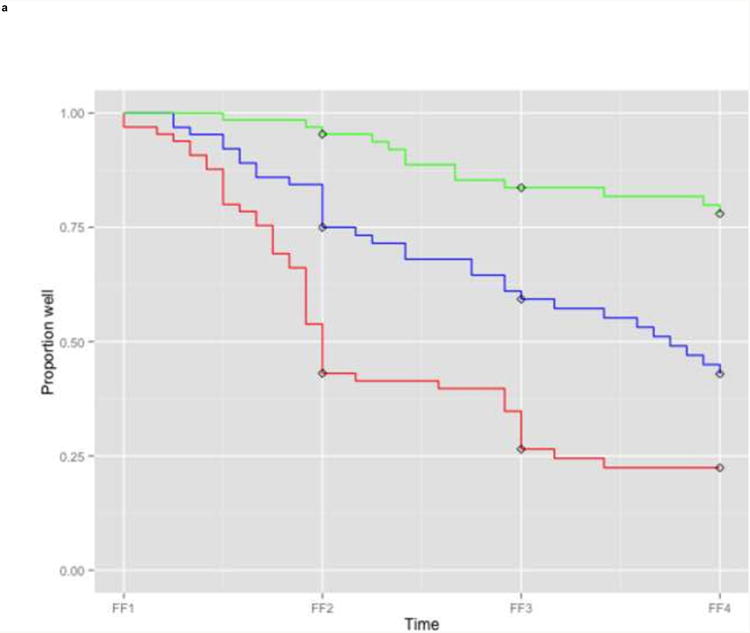
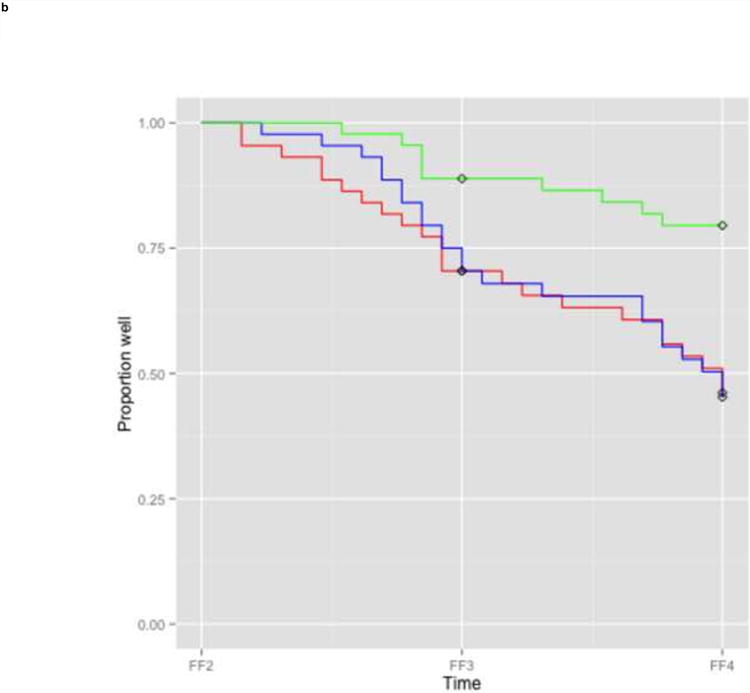
Figure 2. Survival curves for different tertile risk groups.


a: Training sample (n=194)
b: Test sample (n=133)
Legend: Kaplan Meier survival curves for subjects in the lowest one third (green), intermediate one third (blue), and highest one third risk group (red) based on linear predictor scores derived from the full prediction model. In case of missing information on predictors at FF2, FF1 information was used for the linear predictor score of the test sample. Diamonds indicate censored subjects.
FF1, interview wave 1 (1988-1989); FF2, interview wave 2 (1990-1991); FF3, interview wave 3 (1992-1994); FF4, interview wave 4 (1995-1997)
