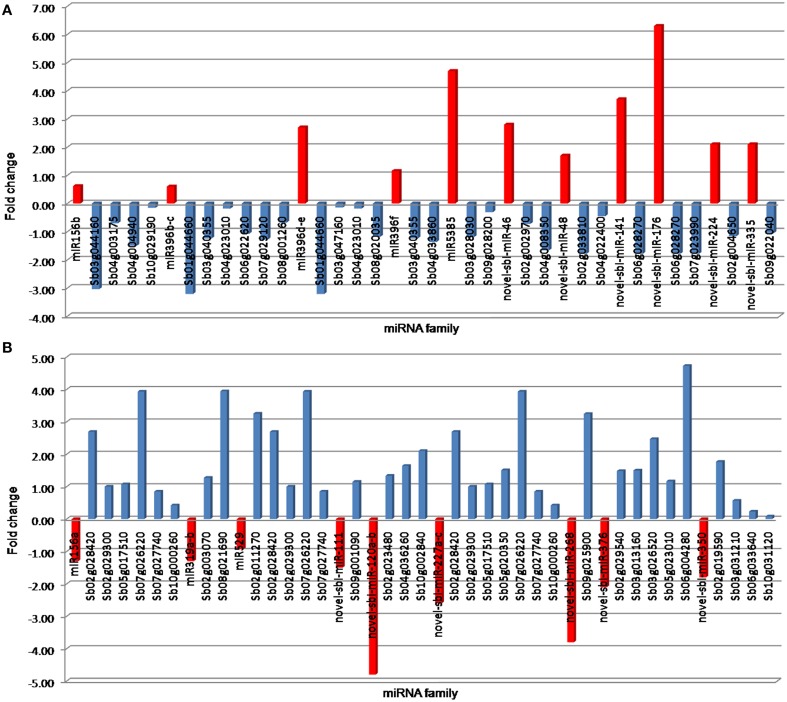
Figure 4.
Negative correlation between drought-responsive miRNAs and their predicted target genes; where (A,B) represents miRNA up, target gene down, and vice versa, respectively. The miRNA expressions obtained by next-generation sequencing is represented by red color. The color blue represents the expression level of target genes obtained from transcriptome analyses of sorghum.

