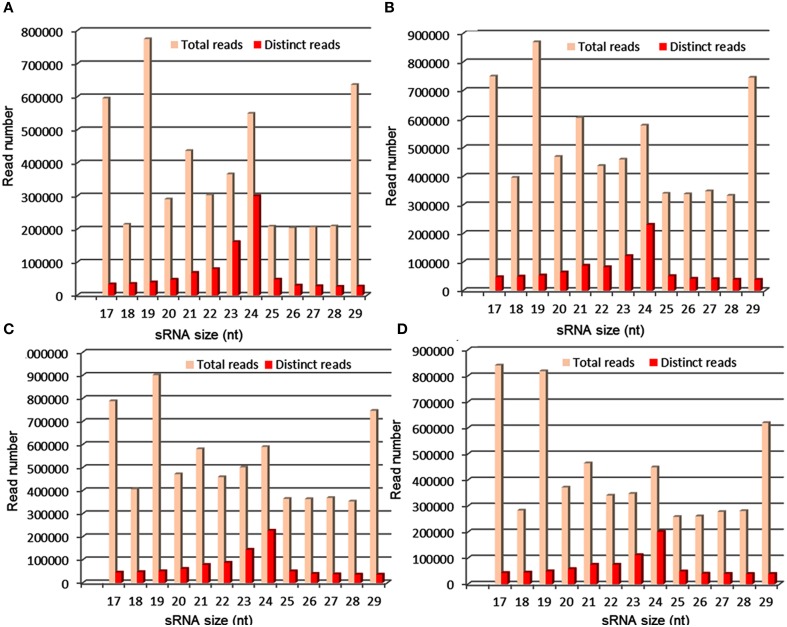
Figure 5.
Distribution of sRNA reads produced from control and drought stress libraries of sorghum; where, (A,B) represents reads distribution in control and stress library of drought-susceptible genotype, respectively. (C,D) Represent reads distribution in control and stress library of drought-tolerant genotype, respectively. The highest sRNA read abundance was found for 24 nt in all 4 libraries.

