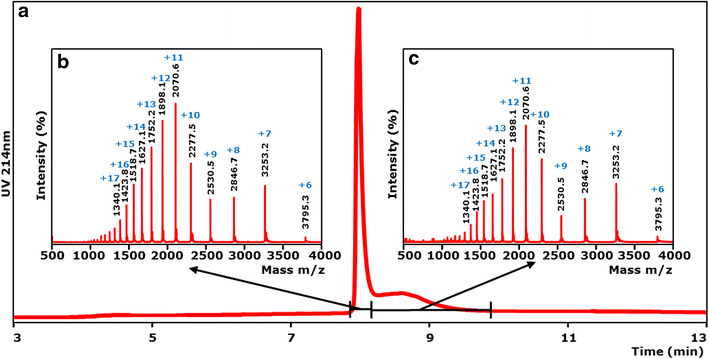
Figure 1.

LC/ESI–MS analysis of MtLPMO9A. Purified MtLPMO9A was analyzed by LC/UV/ESI-MS using an ACQUITY UPLC separation system and a SYNAPT ion mobility mass spectrometer. a Chromatographic profile of purified MtLPMO9A (UV 214 nm). ESI MS spectra (m/z values) of the main peak (b) and a shallow peak (c) observed by UV. The main and shallow peak showed exactly the same mass spectrum corresponding to the same protein with an m/z of 22,765 Da. The main and shallow peak together featured about 99.5% of the total area measured in the UV trace at 214 nm and 94.7% of the total area measured in the total ion current (TIC) mass chromatogram (See “Methods”). Blue numbers represent different charge states of MtLPMO9A.
