
Fig. 2.
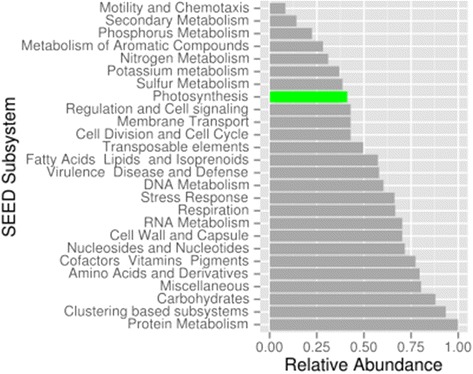
Transcripts expressed by a single cell isolate of Polykrikos lebouriae. Transcripts are ranked from values 0 to 1 in abundance, and annotated according to Level 1 Subsystem hierarchical classification in MG-RAST. Predicted photosynthetic transcripts are shown in green