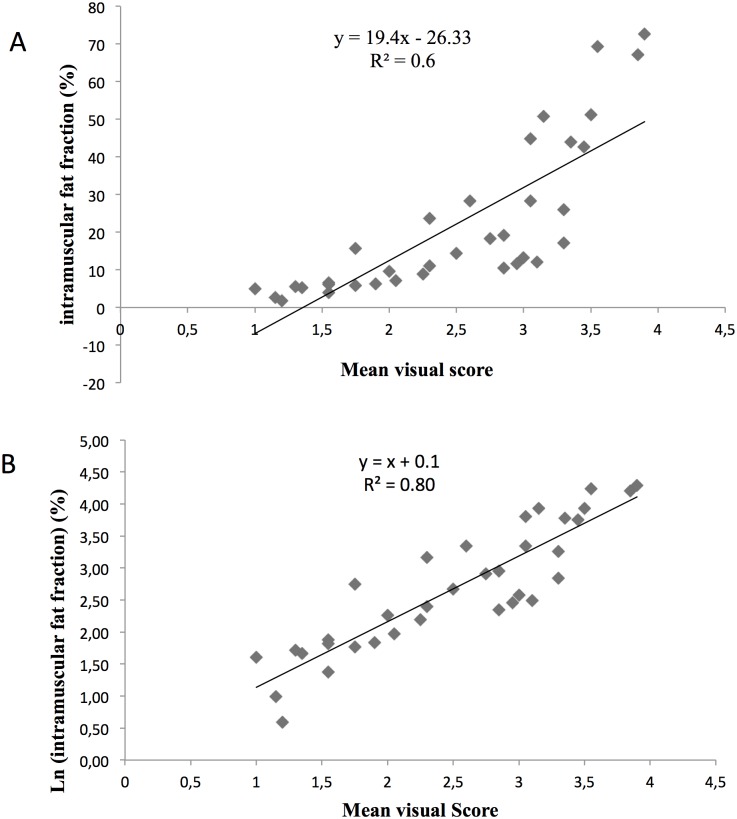
Fig 6. Correlation of intramuscular fat fraction with mean visual score of muscular fatty infiltration.
A: Correlation between the mean visual score of the thighs and the intramuscular fat fraction. B: Correlation between the mean visual score of the thighs and the Log of the intramuscular fat fraction.

