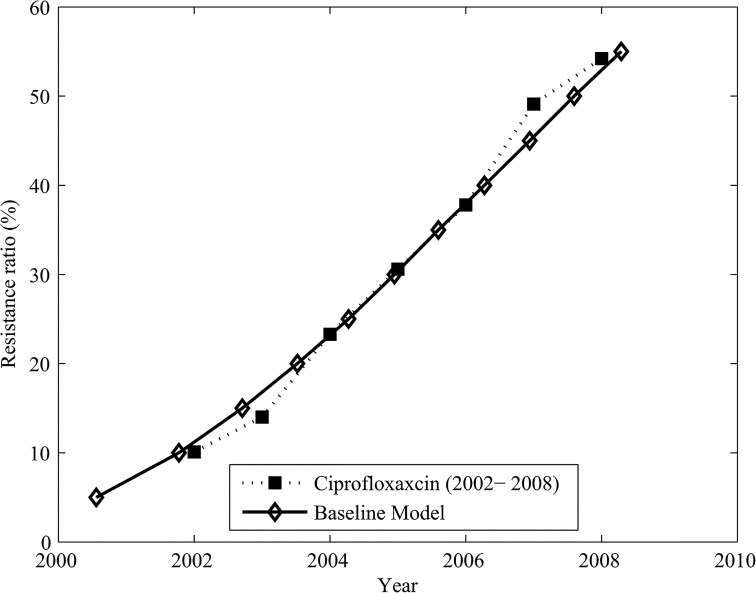
Fig 2. Resistance proportion obtained in the model through calibration to data on ciprofloxacin resistance in Australia.
Resistance proportion obtained in the model (solid line with diamond markers) through calibration to data on ciprofloxacin resistance in Australia between 2002 and 2008 (dotted line with square markers, from [22]).

