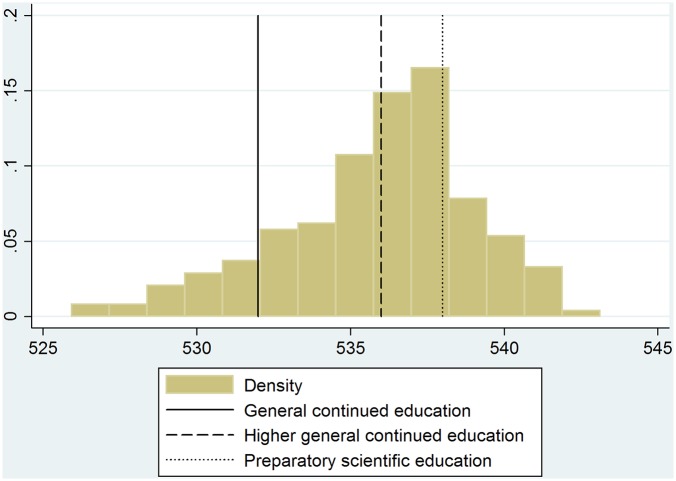
Fig 3. Distribution of the school quality measure.
Notes: These are school level averages of nation-wide end of primary education achievement tests (CITO scores). The CITO test is designed to have a score ranging from 500 to 550 for each individual student. The vertical lines mark the recommended thresholds for secondary school admission. The figure shows the distribution of the school level three year average of the CITO scores from 2008, 2009 and 2010.

