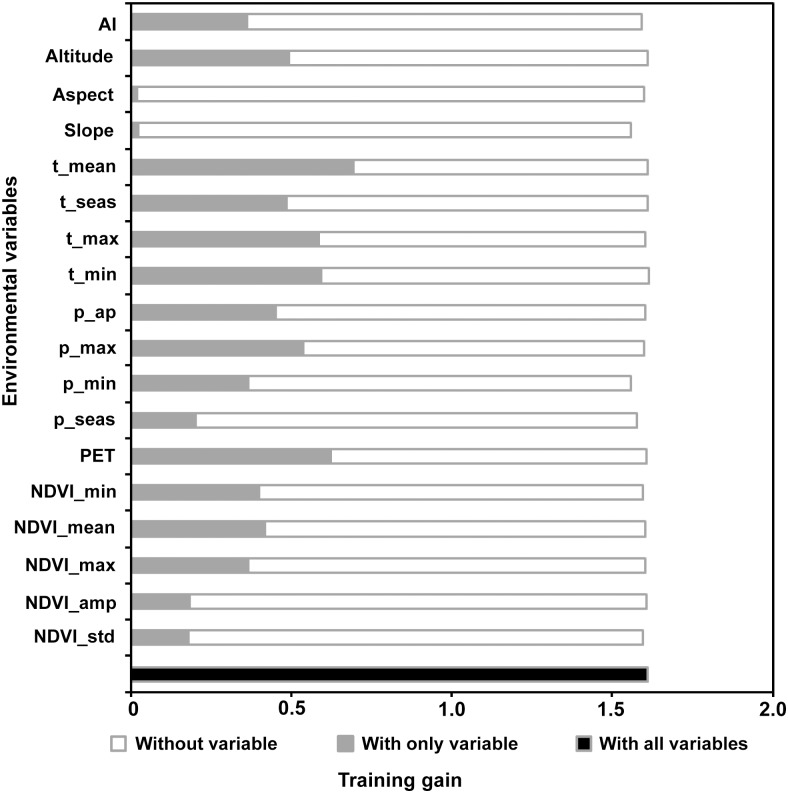
Fig 4. The importance of 22 environmental variables in modeling the distribution of Didymodon in Tibet.
The training gain describes how much better the MaxEnt distribution fits the presence data compared to a uniform distribution. The names and descriptions of environmental variables are listed in Table 2. The white squares represent the effect of removing a single variable from the full model. The gray squares represent the training gains when using only one environmental variable in MaxEnt. The black square represents the training gains when all variables were run in MaxEnt (1.61).

