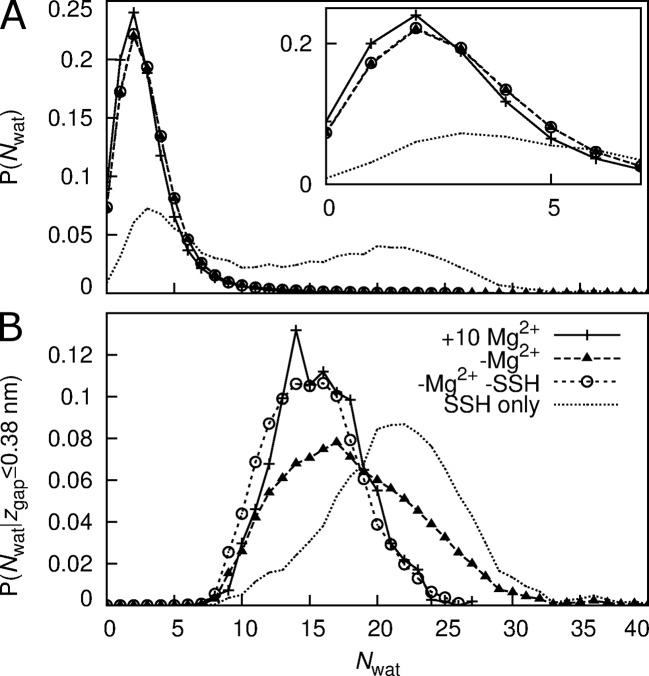
Fig 6. Distribution of N wat in the MM.
(A) all conformations and (B) only those conformations with a wetted MM; for systems (plus symbols and solid line) with regulatory ions and (filled triangles and broken line) without regulatory ions. Dotted line represents this probability for the entire duration of the 8 simulations that sampled SSH states. Empty circles and dashed line represents this probability for the system without regulatory ions after removing the simulations that sampled SSH states from the analysis.

