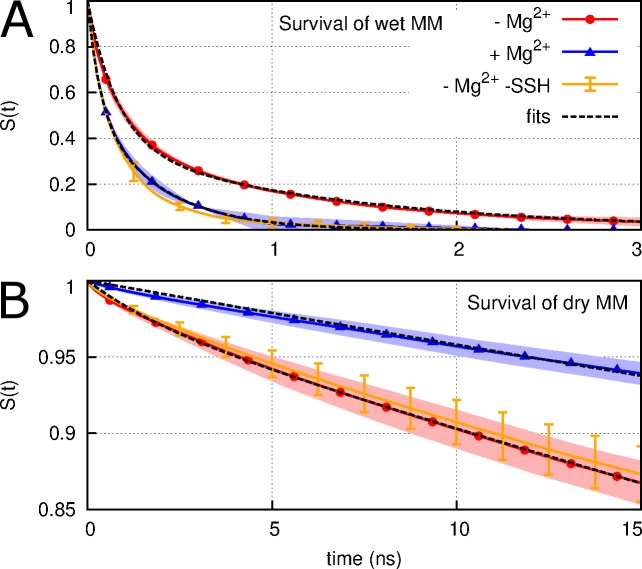
Fig 7. Survival probabilities.
(A) completely connected water columns and (B) partial dehydration in the MM; for systems (blue line) with regulatory ions and (red line) without regulatory ions. The orange line was computed for the system without regulatory ions after removing the simulations that sampled SSH states from the analysis. Error estimates are the standard deviations obtained after dividing each set of 700 simulations into two groups.

