
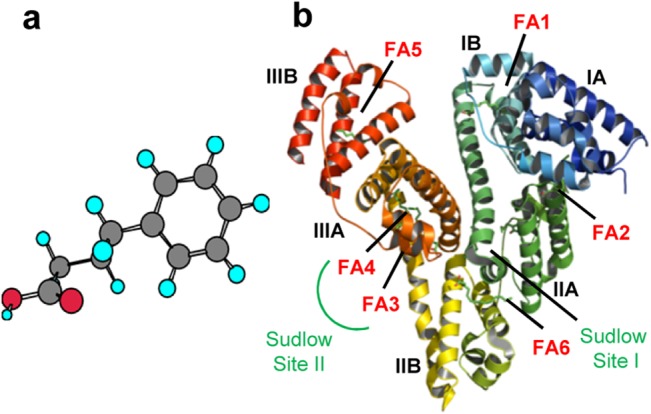
Fig 1. A) Ball and Stick representation of 4PBA; Carbon = Grey, Hydrogen = Cyan, Oxygen = Red b) Cartoon model of HSA-MYR complex (PDB: 2BXP) showing different subdomains and major fatty acid binding sites.
Official websites use .gov
A
.gov website belongs to an official
government organization in the United States.
Secure .gov websites use HTTPS
A lock (
) or https:// means you've safely
connected to the .gov website. Share sensitive
information only on official, secure websites.