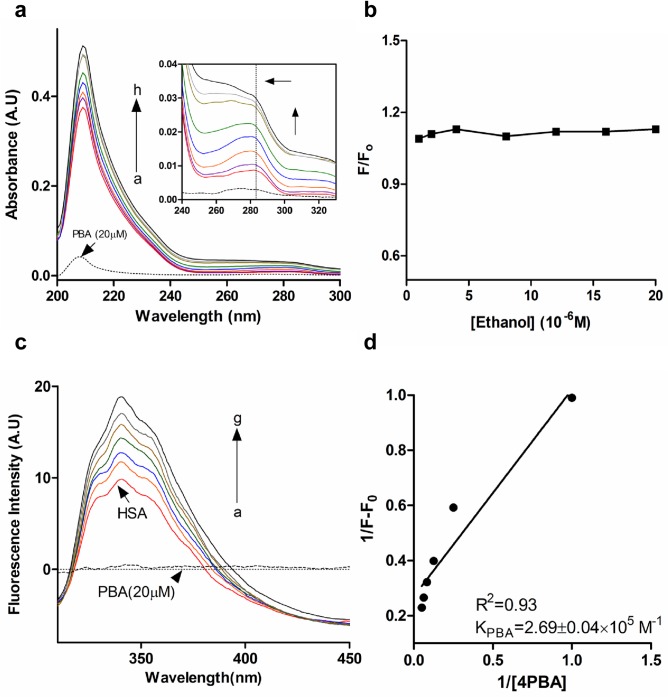
Fig 2. Interaction of 4PBA with HSA.
a) UV-Vis spectra of HSA in presence of 4PBA. Cuvette concentration, cHSA: 1μM (a) and c4PBA (1,2,4,8,12,16,20 μM): b→h; pH 7.4 at 25°C. Inset shows slight blue shift at the Tryptophan absorption region indicated by the arrow. b) Effect of ethanol on the fluorescence emission intensity of HSA. cHSA = 1μM, cEthanol =, 1,2,4,8,12,16,20 μM (pH 7.4, 25°C) c) Fluorescence emission spectra of HSA in presence of 4PBA. cHSA: 1μM (a) and c4PBA (2,4,8,12,16,20 μM): b→g; pH 7.4 at 25°C.Dotted line represents contribution of4PBA (20μM) at the emission range of HSA. d) Plot of 1/F-F0 vs 1/ [4PBA]

