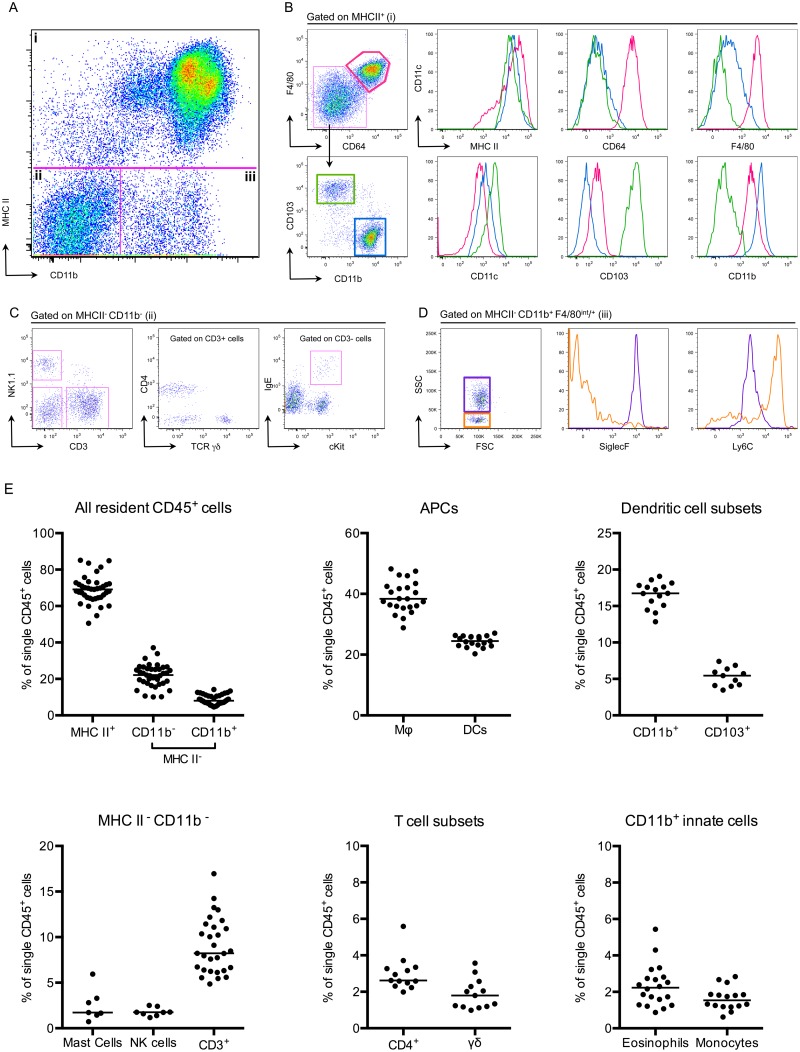
Fig 2. The bladder contains a diverse immune cell repertoire.
Naïve bladders from female C57Bl/6 mice were digested for flow cytometry. Single cell preparations were stained with antibodies indicated in Table 2. (A) Single, CD45+ cells were gated into 3 groups (i-iii) according to their CD11b and MHC II expression levels. (B) MHC II+ cells from gate (i) were divided into 3 populations, F480+ CD64+ macrophages (pink gate), CD11b+ DCs (blue gate) and CD103+ DCs (green gate). The expression levels of MHC II, CD64, F4/80, CD11c, CD103, and CD11b are depicted in the histograms (macrophages—pink lines, CD11b+ DCs—blue lines, CD103+ DCs—green lines). (C) MHC II- CD11b- cells from gate (ii) were subdivided by their expression of CD3 and NK1.1. CD3+ cells were divided into CD4+ and TCR γδ+ and the CD3- gate shows cKit+ IgE+ mast cells. (D) The dot plot, from gate (iii) depicts MHC II- CD11b+ F480int/+ eosinophils (purple gate) and monocytes (orange gate). Histograms depict expression levels of SiglecF and Ly6C from gate (iii) (eosinophils—purple lines, monocytes—orange lines). (E) Graphs depict immune cell populations in the naïve bladder as percentage of all CD45+ cells. Representative cytometry dot plots and histograms from different individual bladders are depicted, with the exception of the mast cell plot in (C), which depicts three pooled bladders due to the low number of mast cells. In (E), each dot represents one bladder, lines are medians, plots are pooled from three or more experiments.

