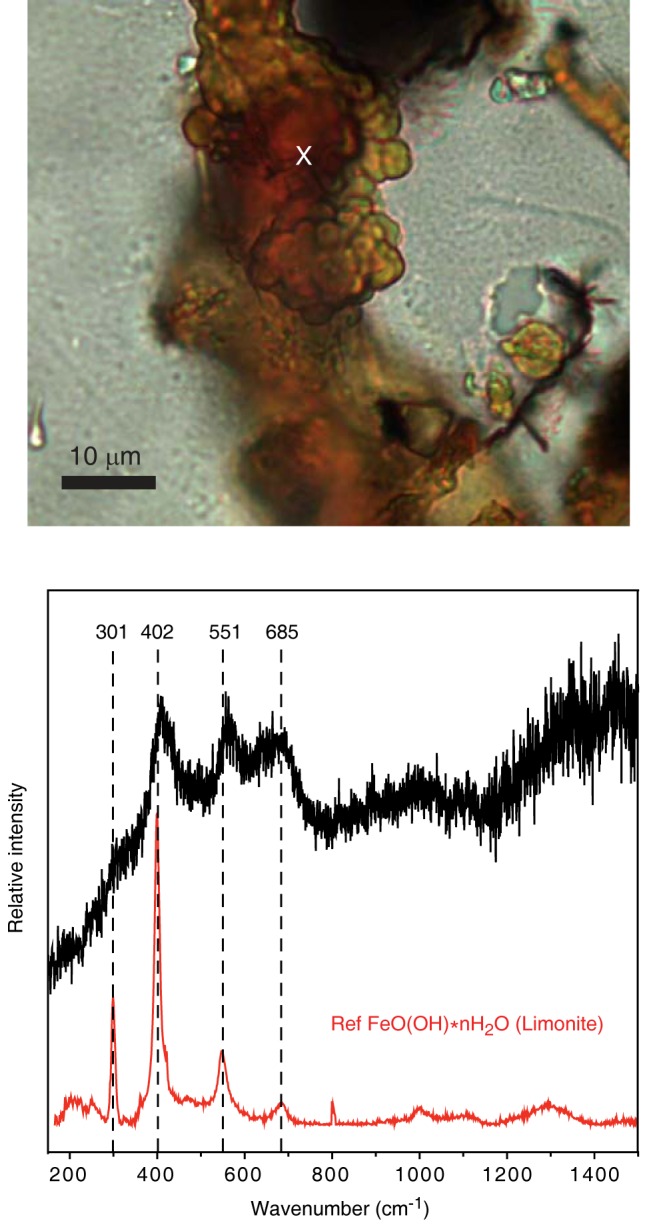
Fig 6. Raman spectrum of a filament.

The obtained spectrum is identified as FeO(OH) * nH2O (limonite) after comparison with RRUFF reference spectra from Downs (2006) with typical bands at 301, 403, 551 and 685 cm-1. The position were the spectrum was taken is indicated by a ‘x’ in the photomicrograph.
