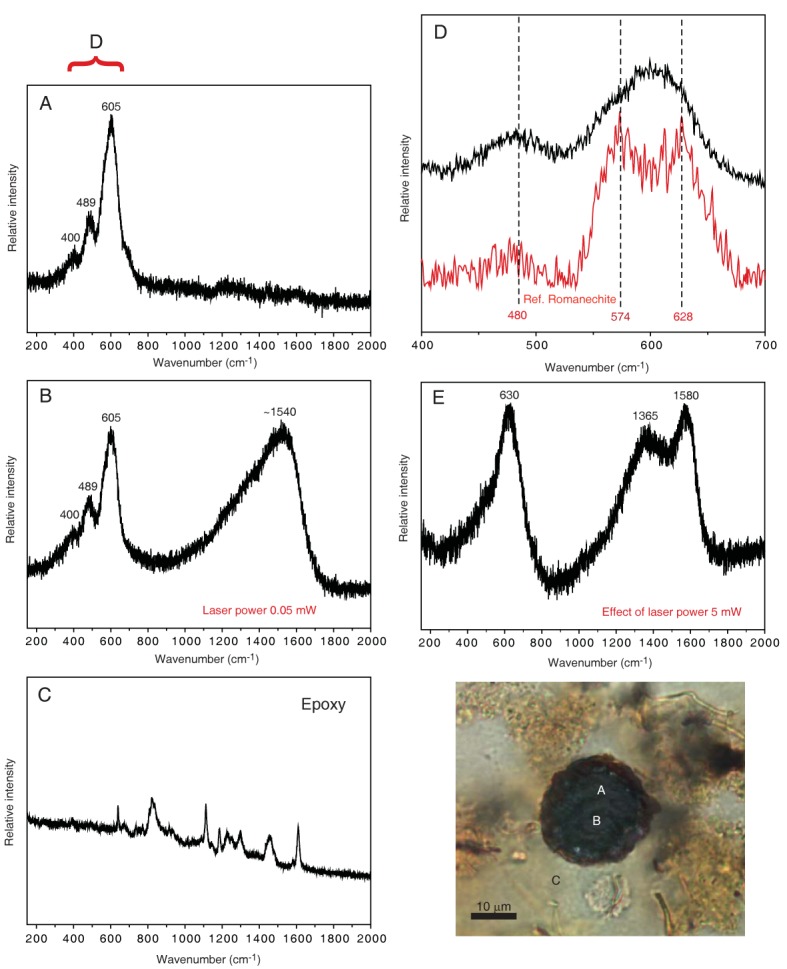
Fig 7. Raman spectra of the dark spherical structures.

The obtained spectra are identified after comparison with RRUFF reference spectra from Downs (2006). The analyses were made using a low laser power (0.05 mW) at the positions in the sample that is indicated by the letters A to C in the photo. The corresponding spectra measured in the range 150 to 2000 cm-1 are given in A-C. The spectra in A and B display bands at 400, 489 and 605 cm-1 that suggest a Mn oxide phase and in spectrum B an additional band around 1540 cm-1 can be recognized which indicates carbonaceous material. (C) Representative spectrum of the epoxy used to make the thin sections to support the assertion that the Raman spectra of the spherical structures are from the rock sample. (D) The 605 cm-1 band consists of overlapping bands and spectra best match a romanechite-like manganese dioxide phase characterized by broad bands at 480, 574 and 628 cm-1; scale of the x-axis has been adjusted to the range between 400 and 700 cm-1. (E) Influence of a higher excitation power (5 mW) with the resultant transition of the romanechite-like phase to a todorokite-like manganese dioxide phase (the band at 630 cm-1) and the carbonaceous phase to slightly more ordered material (with bands centered at about 1365 and 1580 cm-1).
