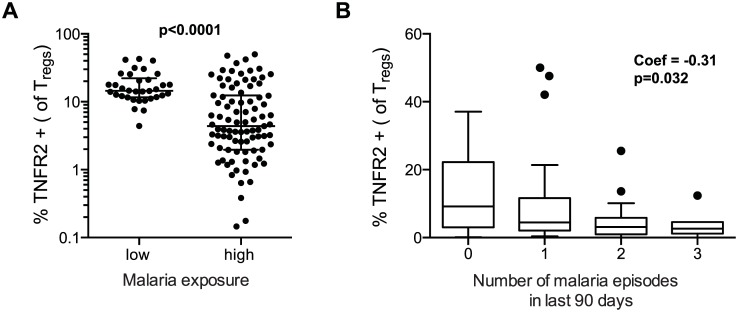
Fig 4. TNFR2 expression on FoxP3+ regulatory T cells declines with increasing prior malaria incidence.
A. Frequencies of TNFR2 expressing Tregs (FoxP3+CD25+CD127dim) were compared between children in the high malaria transmission area (Tororo District) and in the low transmission area (Jinja district). TNFR2 expression on Tregs was higher in low compared to high transmission settings. Wilcoxon signed rank test indicated. B. The association between frequencies of TNFR2 expressing Tregs and number of recent malaria episodes was analyzed among children from high malaria exposure area (Tororo District). TNFR2 expression declined with increasing number of malaria episodes in last 90 days. Regression coefficient and p value are indicated.

