
FIGURE 2.
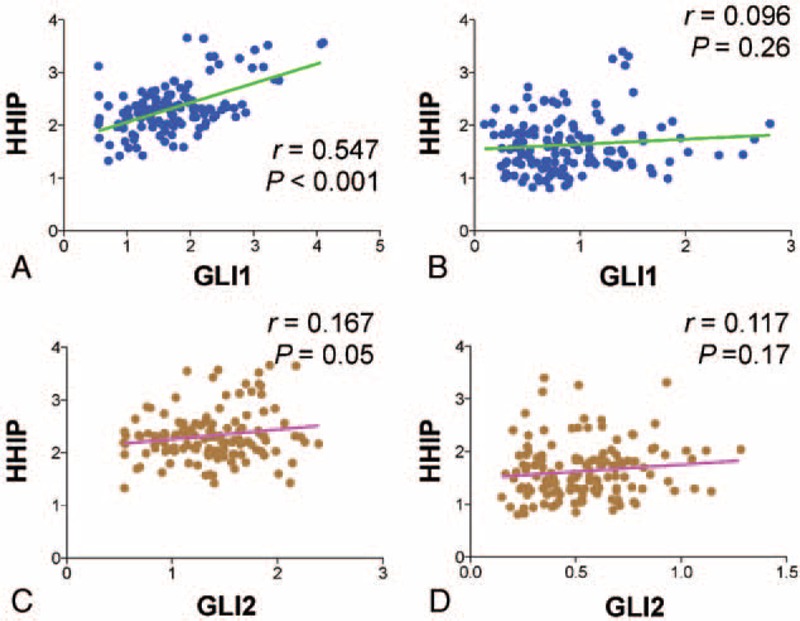
Correlation between expression levels of the central components of the Hh pathway. (A and B) Correlation between GLI1 and HHIP relative mRNA expression in normal thyroid tissues (A) and PTC (B). (C and D) Correlation between GLI2 and HHIP relative mRNA expression in normal thyroid tissues (C) and PTC (D). Linear correlations between 2 groups were analyzed by Pearson R correlation test. GLI1 = glioma-associated oncogene homolog 1, Hh = Hedgehog, HHIP = Hedgehog-interacting protein, mRNA = messenger ribonucleic acid, PTC = papillary thyroid cancer.