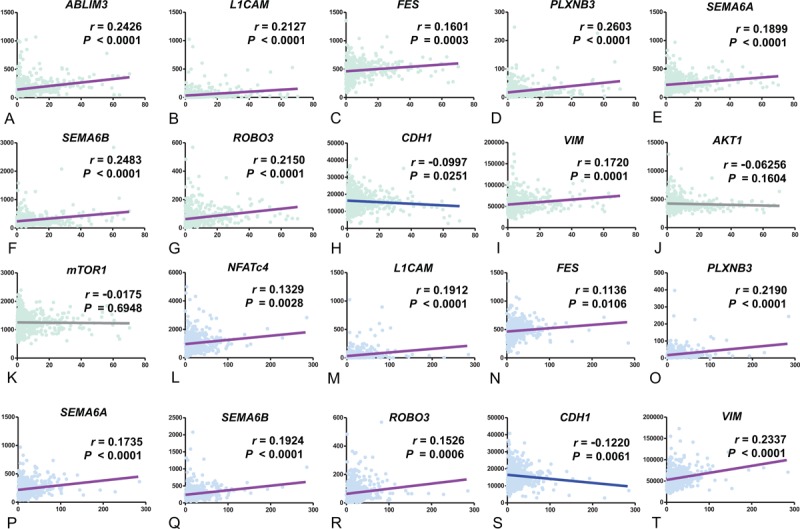
FIGURE 5.

Correlation analyses of GLI1 (A-K) and GLI2 (L-T) with axon guidance genes using public repository data from The Cancer Genome Atlas Research Network. GLI1 = glioma-associated oncogene homolog 1, GLI2 = glioma-associated oncogene homolog 2.
