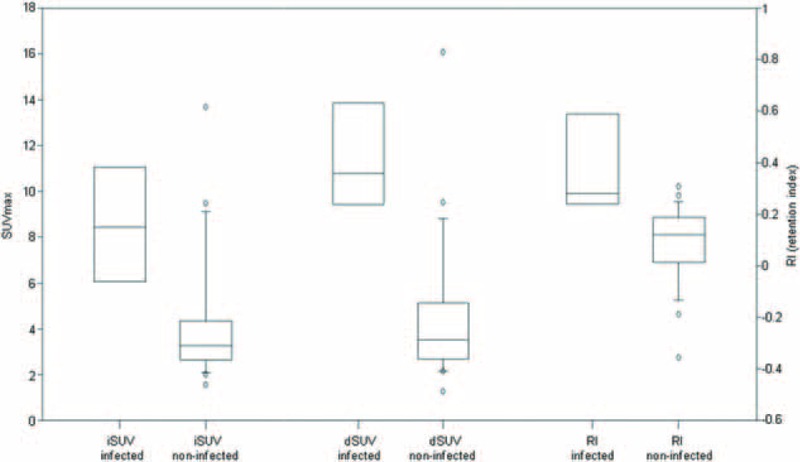
FIGURE 1.

Box plots of iSUV, dSUV, and retention index (RI) of the infected and noninfected aortic grafts were shown. The infected grafts generally had higher iSUV, dSUV, and RI than noninfected grafts (P < 0.01, Mann–Whitney rank sum test). dSUV = SUVmax of the aortic graft on delayed image; iSUV = SUVmax of the aortic graft on initial image.
