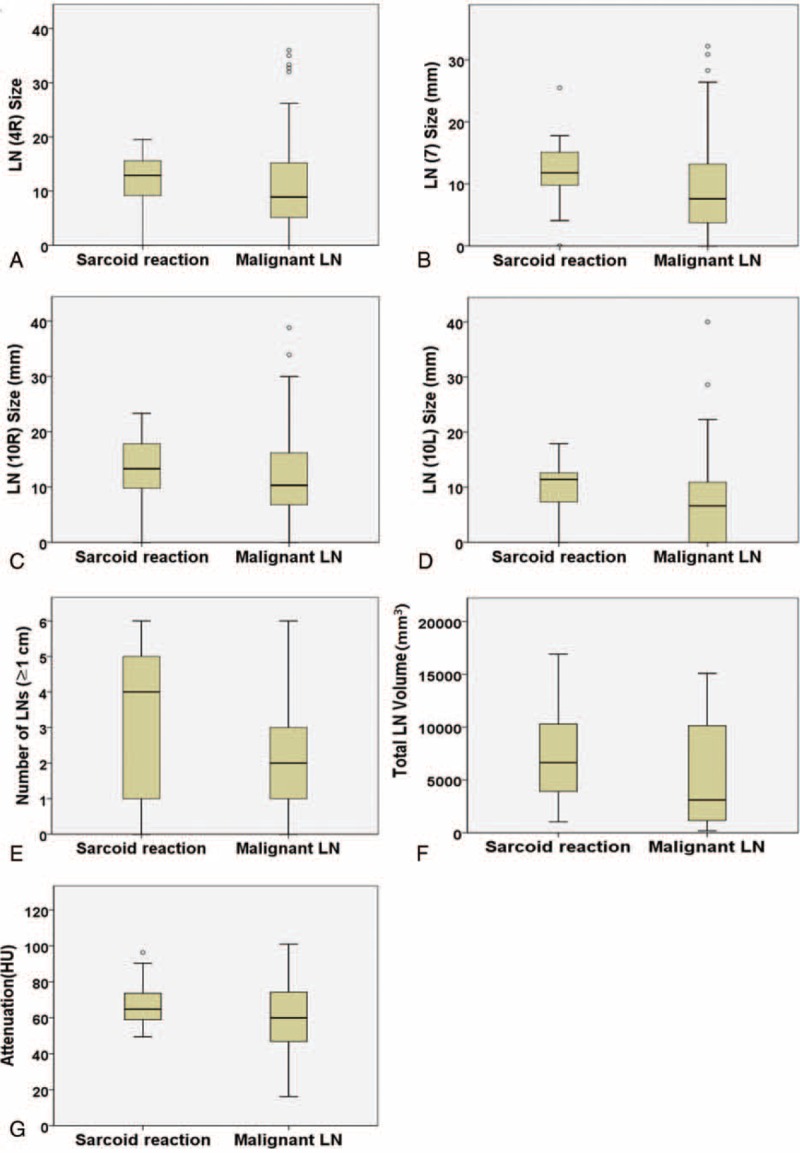
FIGURE 4.

Box plots to show the distributions of the sizes of each nodal station, the number of LNs >1 cm, total volume, and attenuation of LNs in the sarcoid reaction and malignant LNs. (A–D) The LNs of sarcoid reaction tend to be larger with narrow spectrum than the malignant LNs (right lower paratracheal, 4R; subcarinal, 7; right hilar, 10R; left hilar, 10L). (E) There are more LNs >1 cm per patient in sarcoid reaction compared with the malignant LNs. (F) The total volume of LN is lower in sarcoid reaction than in malignant LNs. (G) The attenuation of all LNs is not significantly different between the 2 groups. LNs = lymph nodes.
