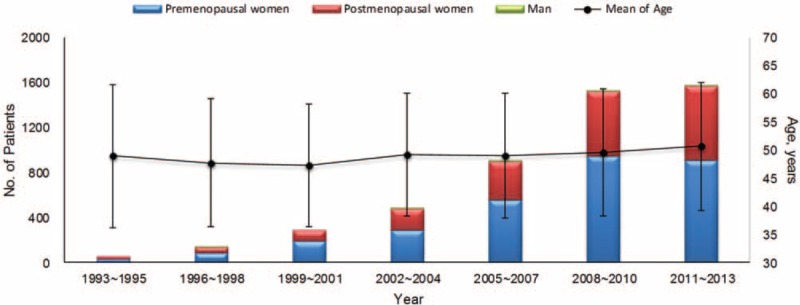
FIGURE 1.

The distribution of patients numbers and mean age every 3 years from 1993 to 2013 in the study. The numbers of sex and status of menopause were also labeled in the figure.

The distribution of patients numbers and mean age every 3 years from 1993 to 2013 in the study. The numbers of sex and status of menopause were also labeled in the figure.