FIGURE 4.

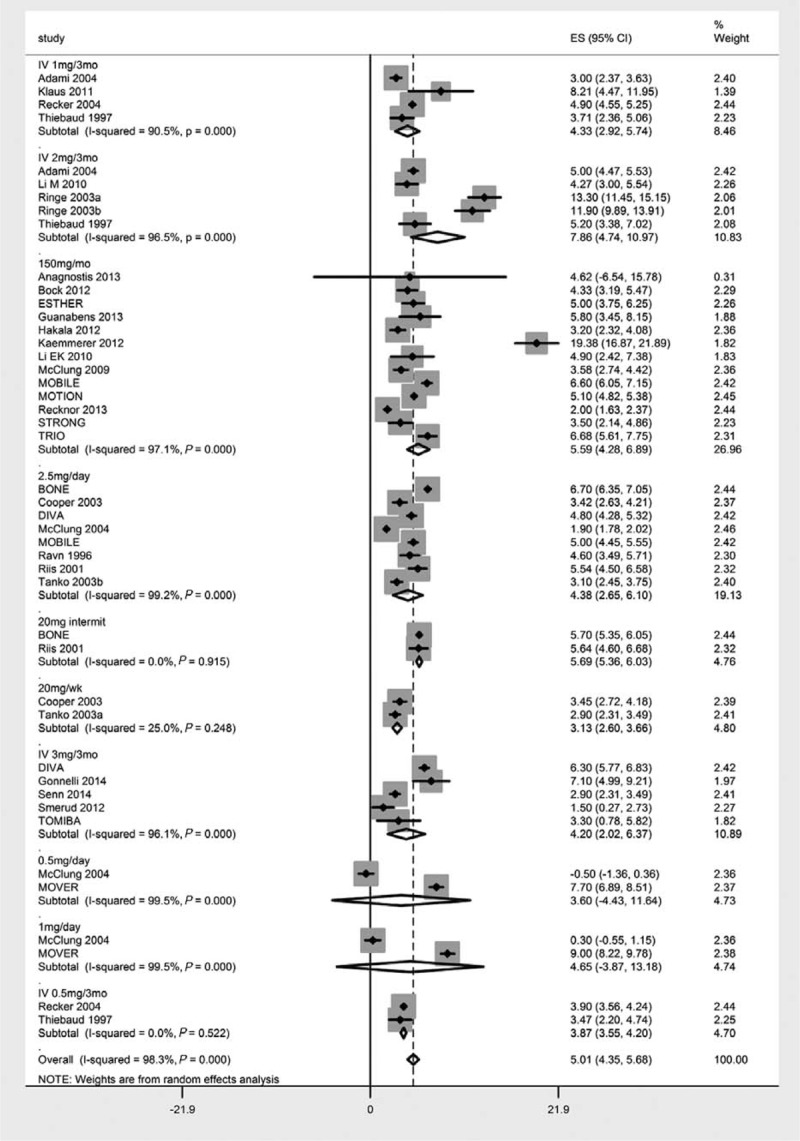
Forest chart showing dose-wise effect sizes (percent change in the bone mineral density following ibandronate treatment) achieved in this meta-analysis.

Forest chart showing dose-wise effect sizes (percent change in the bone mineral density following ibandronate treatment) achieved in this meta-analysis.