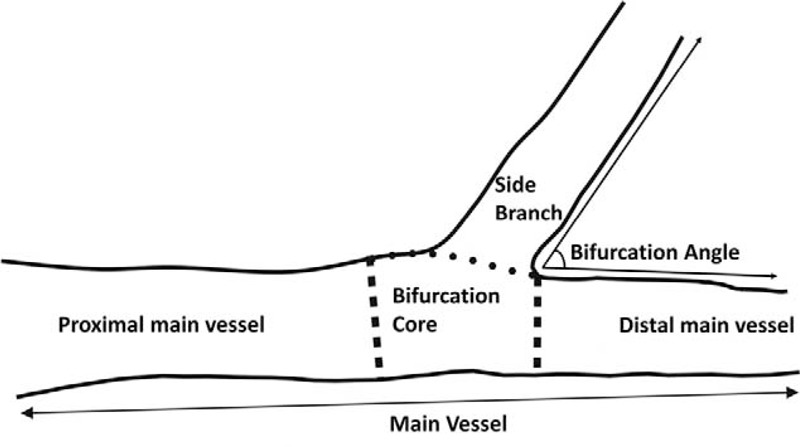
FIGURE 3.

Schematic diagram of quantitative coronary angiographic analysis. Bifurcation lesions were analyzed as 4 segments: the proximal MV segment, the distal MV segment, the SB segment, and the bifurcation core segment. MV = main vessel, SB = side branch.
