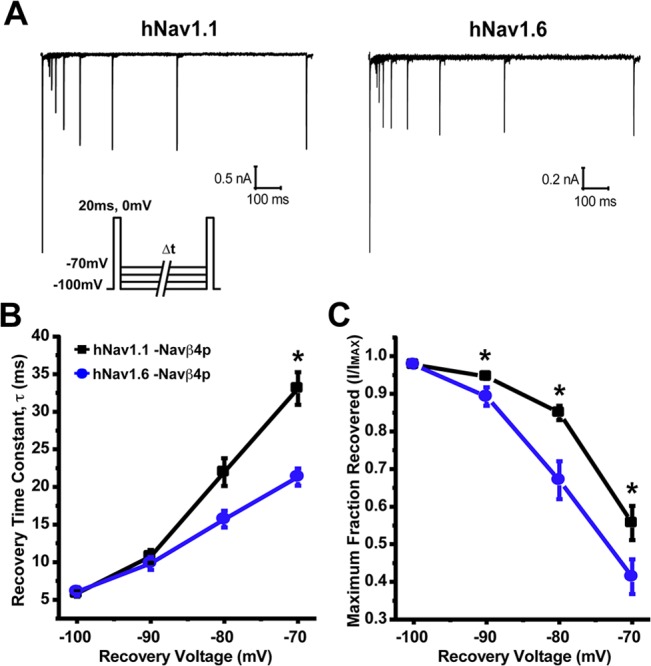
Fig 3. Rate and fraction of recovery from fast inactivation by hNav1.1 and hNav1.6.

A, Representative traces of recovery from fast inactivation measured by first inducing fast inactivation from a holding potential of -100mV with a 20ms step pulse to 0mV and then applying a 20ms test pulse to 0mV subsequent to various recovery times at -70mV. Inset, Protocol used to measure recovery from fast inactivation. B, hNav1.6 (blue circles; n = 17) has a smaller time constant for recovery at -70mV compared to hNav1.1 (black squares; n = 19). C, Maximal fraction recovered from fast inactivation was greater for hNav1.1 at voltage ranging from -90mV to -70mV compared to hNav1.6 (Unpaired t-test, *p < 0.05).
