
Figure 1.
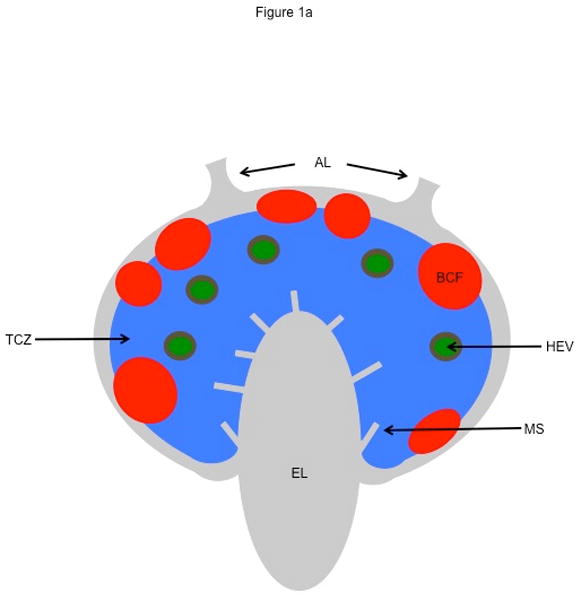
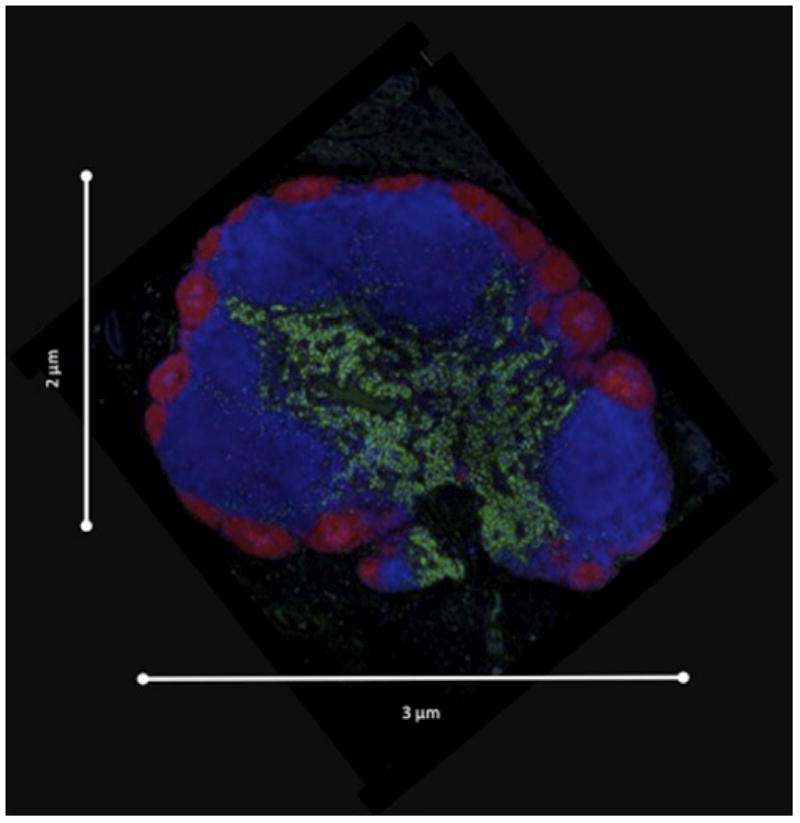
Lymph node structure. (a) Schematic of a lymph node showing afferent lymphatics (AL), high endothelial venules (HEV), medullary sinuses (MS), efferent lymphatics (EL), T cell zone (TCZ), and B cell follicles (BCF). Our focus is a TCZ where activation of T cells occurs. The LN is also the site of B cell activation. B cells are generally confined to the BCF and are not discussed here. (b) Fluorescent image of a Cynomologus macaque lymph node cross-section showing T cells (CD3+, blue), B cells (CD20+, red), and macrophages and dendritic cells (CD11+, green). Lymph node is approximately 3 mm × 2 mm. Image courtesy of JoAnne Flynn and Josh Mattila (Univ. of Pittsburgh).