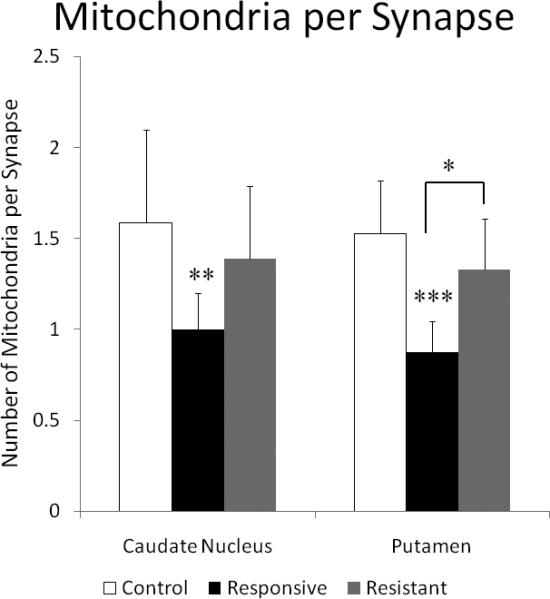
Figure 5.

Graph comparing the number of mitochondria per synapse in the caudate nucleus and putamen. ANOVA showed significant group differences for both the caudate nucleus (p<0.025) and the putamen (p<0.002). In the caudate nucleus, treatment responsive SZ subjects had fewer mitochondria per synapse than that of the NCs. In the putamen, there are significantly fewer mitochondria per synapse in treatment responsive SZ subjects compared to both NCs and treatment resistant SZ subjects. Asterisks indicate results of LSD post-hoc t-tests:* p< 0.05, ** p<0.01, ***, p<0.001 and are placed over the group when comparing with NCs and over the bar comparing treatment responsive to treatment resistant SZ subjects.
