
Extended Data Figure 1. Dynamic interfacial tension data was used to estimate the equilibrium interfacial tensions for the hexane–water and perfluorohexane–water interfaces.
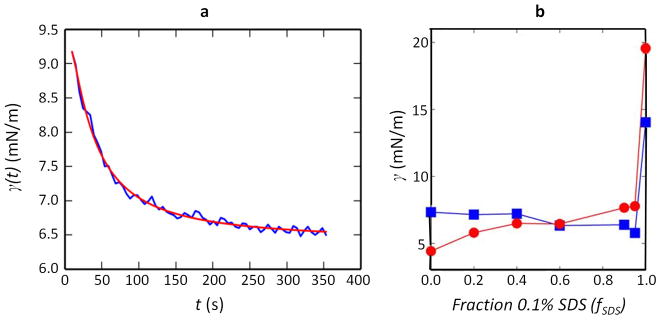
a, Dynamic interfacial tension data (in blue) was obtained from the pendant-drop method; the representative data shown here was measured for the hexane–water interface at fSDS = 0.9 (such that the aqueous solution contained 0.1% SDS and 0.1% Zonyl in a 9:1 ratio). The data was fitted to an empirical model (in red) to estimate the equilibrium value of the interfacial tension γeqb = γ(t → ∞). Such fitting was performed for all measured interfacial tensions and the fitted parameter results are tabulated in Extended Data Table 1. b, The estimated equilibrium interfacial tension values were used to plot the hexane–water (squares) and perfluorohexane–water (circles) interfacial tensions as a function of the fraction of 0.1% SDS, fSDS, where the other fraction is 0.1% Zonyl. See discussion in Methods section for more details.