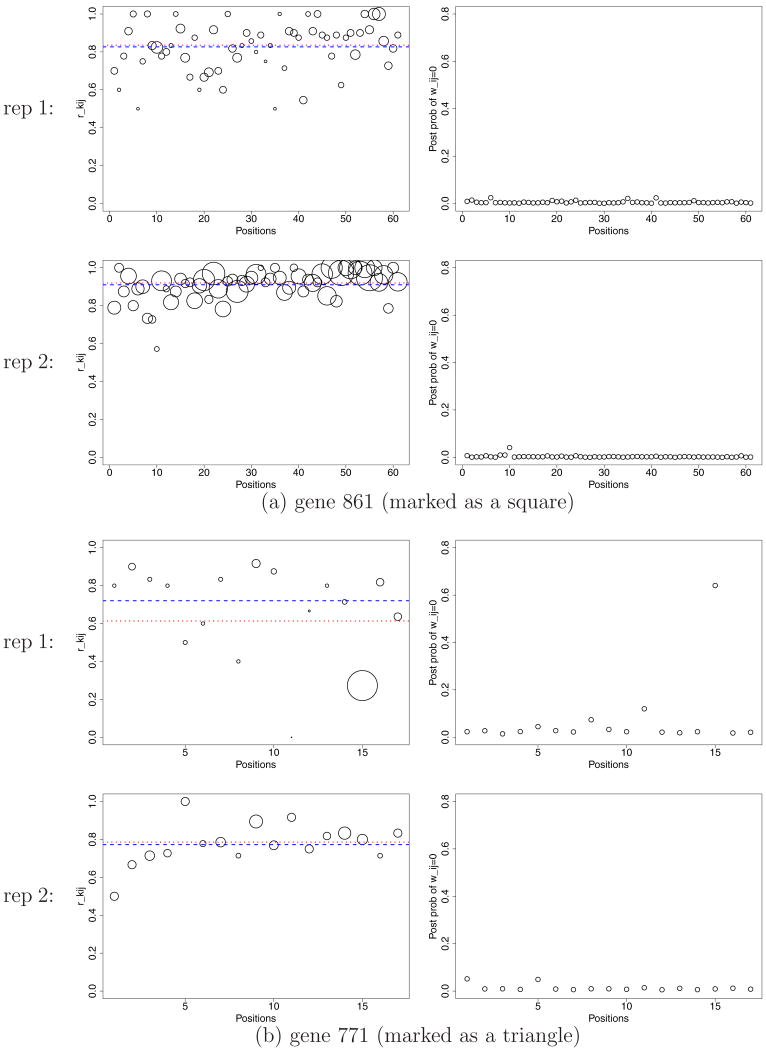
Figure 10.
Yeast data: Inference summaries for the genes marked as a square and a triangle in Figure 9 (a) and (b). In each panel, the first column plots rkij where the areas of the circles are proportional to Nkij. The dotted line indicates31rki. The dashed line shows the posterior mean ξ̂ki (plotted at logit−1ξ̂ki to map to the unit scale). The second column plots ŵkij. The first and second rows are plots for replicate 1 and 2, respectively. Note the discrepancy between posterior inference and rki for replicate 1 of gene 771. This discrepancy is mainly due to outlying positions such as position 15.

