
Fig 1. Effect of sampling.
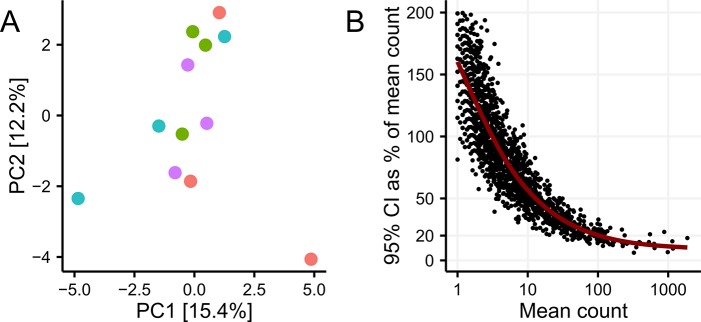
(A) No clustering by sampling site was seen in the PCA analysis of square root transformed OTU abundances (padonis = 0.53, nseq = 17000, nsample = 12). (B) OTU level variation when sequencing three biological replicates as a function of sequencing depth. Variation was measured as the 95% confidence interval in percentage of the mean OTU read count (nseq = 32000, nsd = 11, nse = 3).