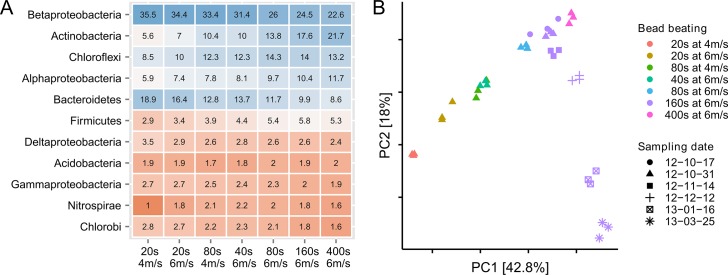
Fig 3. The effect of bead beating on the observed microbial community composition.
(A) Percentage read abundance of the 11 most abundant phyla as function of bead beating intensity (Proteobacteria are show at class level). The data is visualized as a table with the underlying colors visualizing the changes. (B) Principal component analysis of the samples extracted with different bead beating intensities compared to the samples taken at different dates, but extracted with the same bead beating settings (160 s at 6 m/s).

