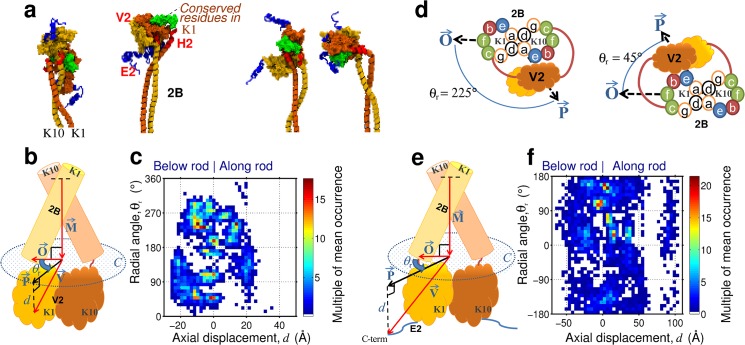
Fig 3. Positioning of the tail domain.
(A) Exemplar positional preferences of the tail domain. (B and E) schematics of 2B and tail domain showing key measurements made on V2 and E2 head domains (definitions of vectors are given in Methods). (C and F) plots of the occurrence of the positions taken by the V2 globules and C-term of the E2 tail domain, respectively. (D) bottom down diagrams showing the radial positioning of the tail domain and the heptad positions of the 2B rod domain.

