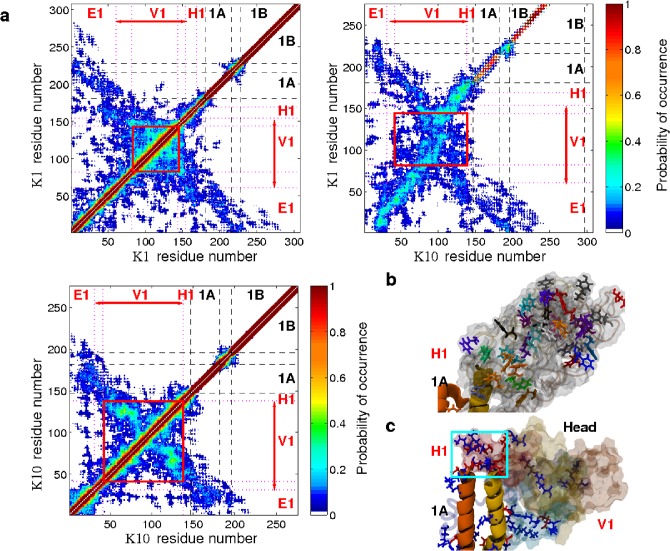
Fig 5. Head domain structure.
(A) Combined contact plots for the head domain and part of the rod domain showing the probability of the C α atoms of a pair of residues being separated by less than 12 Å. The dashed-lines show the boundaries between the head domain and rod subdomains, and dotted-lines indicate changes in the characteristics of the primary sequence (see Section E in S1 File). The letter annotations show which residues correspond to the rod subdomains 1A, L1 and 1B and our proposed head subdomains (H1, V1, E1). The red box indicates the residues that make up glycine loop motifs. (B) Snapshot of the head domain showing the aromatic and glycine loops contained within. (C) Snapshot of the head domain highlighting the acidic (red) and basic residues (blue) interacting between the rod and head domains. The rectangle indicates the location of acid and base pairing between the 1A rod domain and H1 head domain.

