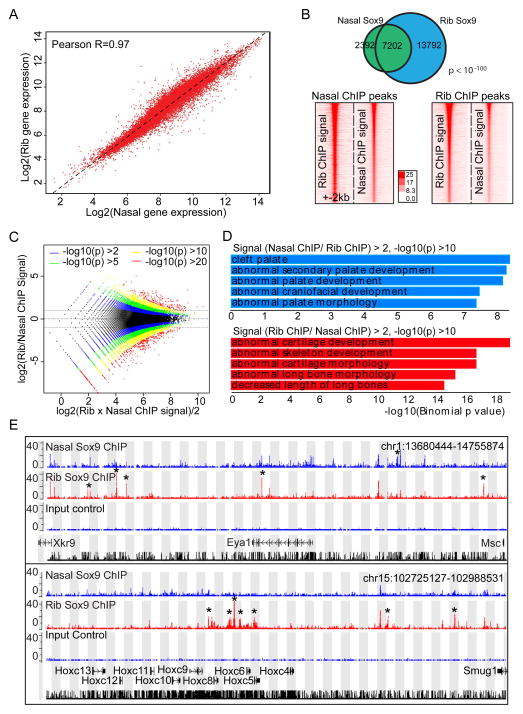
Figure 7. Comparison of gene expression profile and Sox9 binding regions between rib and nasal chondrocytes.
(A) Correlation of gene expression profile between rib and nasal chondrocytes. Different dots represent individual genes. The X- and Y-axis show log2 expression level of each gene in rib chondrocytes and nasal chondrocytes, respectively.
(B) Comparison of Sox9 peaks between rib and nasal chondrocytes. Venn diagram for Sox9 peak intersection between rib and nasal chondrocytes (upper) and intensity plots of Sox9 ChIP-seq signal in nasal and rib chondrocytes (lower) are shown. In lower panels, rib and nasal Sox9 peaks are plotted on a 4 kb window from peak centers according to their ranking (highest ranked at top). Lower left panel indicates Sox9 ChIP-seq signal obtained from rib chondrocytes and lower right panel Sox9 ChIP-seq signal from nasal chondrocytes.
(C) Log-intensity ratios (M-values) versus log-intensity averages (A-values) (MA) plot of rib and nasal chondrocyte Sox9 ChIP-seq peaks. Colors represent different p-value levels for confidence levels.
(D) GREAT GO analysis on peak regions identified by peak intensity MA plots shown in (C). Blue bars, enrichments of terms in regions where Sox9 peak intensities are higher in nasal chondrocytes than in rib chondrocytes; Red bars, enrichments of terms in regions where Sox9 peak intensities were higher in rib chondrocytes than in nasal chondrocytes.
(E) CisGenome browser views of Sox9 ChIP-seq peaks around Eya1 (upper) and Hoxc8 (lower) in nasal and rib chondrocytes. Asterisks highlight differences in Sox9 peak predictions between nasal and rib chondrocyte data sets.

