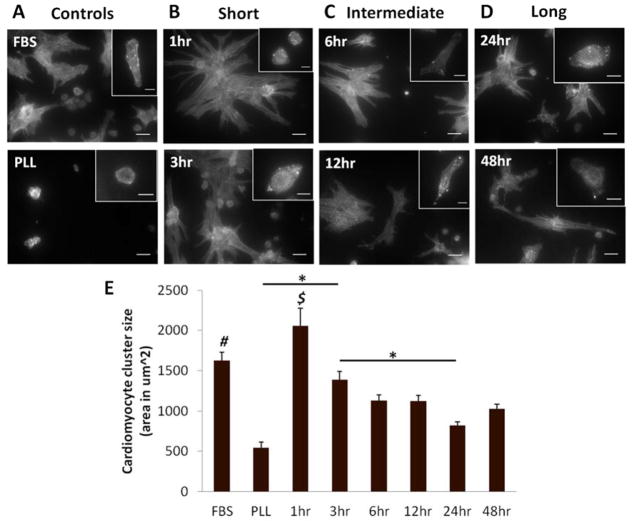
Figure 1. Cardiomyocyte morphology on PD-ECM.
Representative images of cardiac α-actinin stain showing cardiomyocytes at 1 day (insets) and 5 days (full image). (A) FBS-treated controls on PLL (“FBS”) show well spread cardiomyocytes even at 1 day, with small clusters observed at 5 days. PLL controls without serum (“PLL”) had rounded cardiomyocytes at both time points. (B) “Short” digestions of 1hr and 3hr PD-ECM had some spreading at 1 day and large clusters of cardiomyocytes at 5 days. (C) “Intermediate” digestions of 6hr and 12hr PD-ECM had well-spread myocytes at 1 day and small clusters or individual well-spread cells at 5 days. (D) “Long” digestions of 24hr and 48hr PD-ECM resulted in some spreading at 1 day and small clusters and many individual cardiomyocytes at 5 days. Scale bars for insets = 10 μm; full images = 20 μm. (E) Measurements of cardiomyocyte cluster size show significantly larger clusters for FBS and 1hr PD-ECM compared to all other conditions. $ = significant difference vs. all conditions except FBS; # = significant difference vs. PLL, 6hr, 12hr, 24hr, and 48hr PD-ECM. Graph shows mean ± S.E.M.

