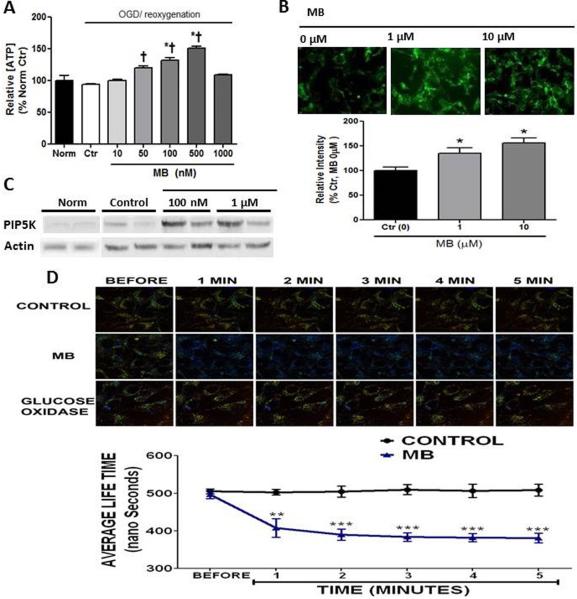
Figure 2. MB increases energy production.
A) ATP concentration was significantly increases in a dose dependent manner, but MB (1μM) increased toxicity. ATP value in control group: 9.89 ± 0.88 μmol/g protein (Mean ± SE) B) MB increases glucose uptake, tested with 2-[N-(7-Nitrobenz-2-Oxa- 1,3-Diazol-4-yl)Amino]-2-Deoxy-D-Glucose (2-NBDG) assay, because of experiment limitation, relatively high doses of MB (1μM and 10μM) were used. C) Phosphatidylinositol 4-phosphate 5-kinase (PIP5K) protein content was increased with MB vs. normoxic and OGD controls D) Fluorescence life time imaging microscopy (FLTIM) showed that MB enhanced intracellular O2 concentration vs. Control. Glucose oxidase was used as a positive control. † p < 0.05 vs. Norm, * p < 0.05 vs. Ctr

