
Figure 5.
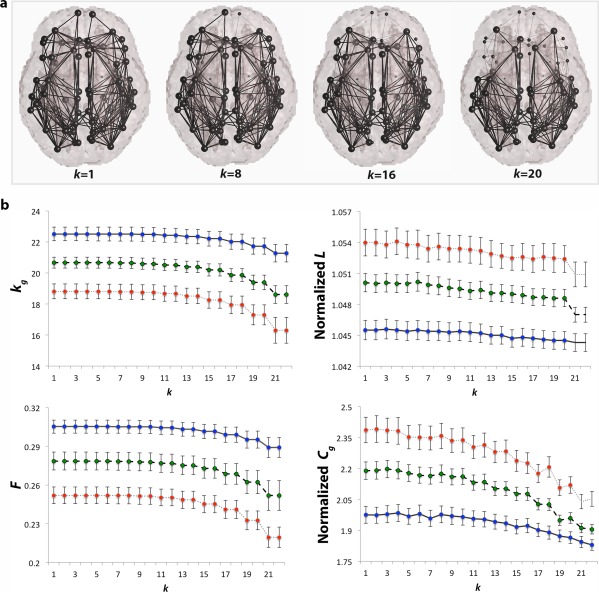
Other network measures. a. Brain networks indicated by thick edges used to compute all supporting graph measures; removed connections (thin edges) are not included in the computation of the network measures as nodal k‐levels increase; b. average global degree (k g), normalized clustering coefficient (Cg), normalized characteristic path length (L), and efficiency (F) computed in controls (CTL, blue), MCI (green), and AD participants (red) over the entire k‐value regime (k = 1–22) in the whole brain networks. As expected, all network measures declined as a function of k in AD and MCI, relative to controls at most k‐levels. Assessed over the entire k‐value regime, these indicate that AD may involve a disruption in the global connectivity of the brain, rather than network topology. Colored dots on the curves indicate that a group difference between CTL and diseased participants was detectable at that value of k. Error bars are the standard error computed at each k level for all group participants. FDR critical P‐values are listed in Table 2. [Color figure can be viewed in the online issue, which is available at http://wileyonlinelibrary.com.]