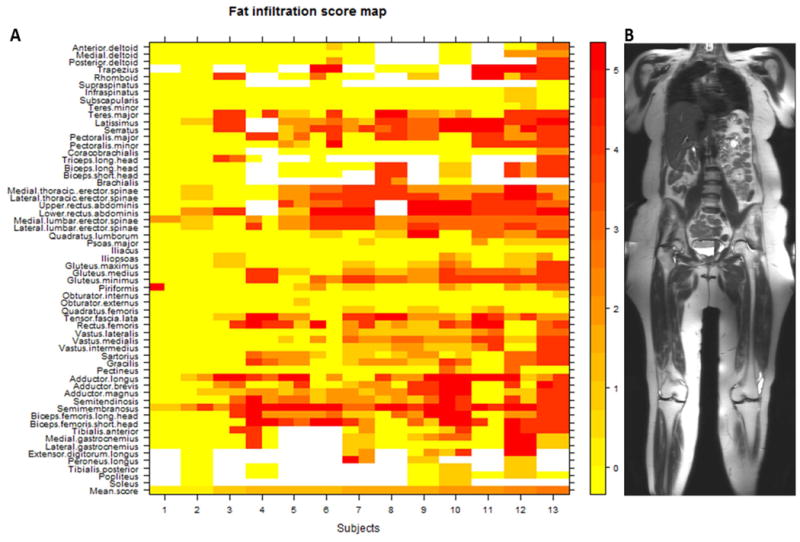
Figure 1.

Heat map (A) of all 1330 muscles scored in 13 individuals with FSHD. Subjects are arranged (left to right) from lowest to highest mean MRI score. Muscles on the left and right sides of the body are placed to the left and right sides (respectively) of the labeled tick marks for each subject. Fat infiltration scores on T1-weighted MRI (from 0 to 5) and their corresponding colors are shown in the numbered bar on the right. The mean MRI score for all muscles scored within a single individual are represented in the bottom row. Muscles are listed in a superior to inferior arrangement, corresponding to the anatomic regions defined by the composite coronal MR image on the right (B).
