
Fig. 6. Reflection.
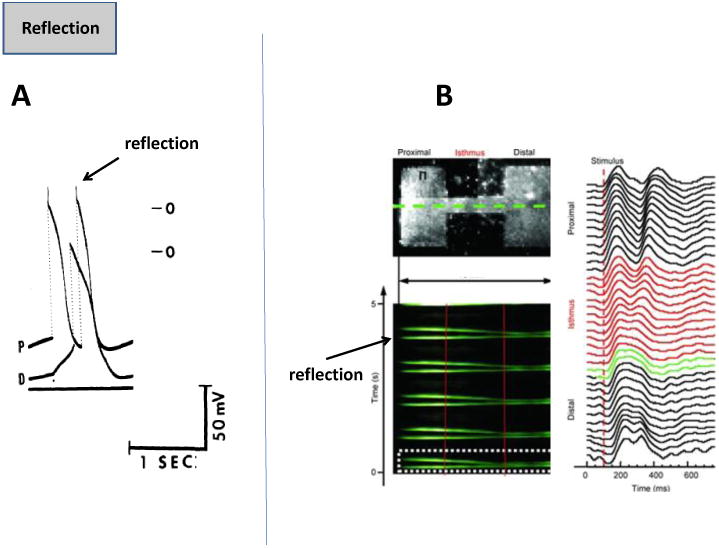
(A.) Shows transmembrane potentials in proximal (P) and distal (D) canine false tendons, with reflection giving rise to a second action potential in the P region [55]. (B.) The top left panel shows two rectangular patches of NRVM connected via a narrow isthmus. The bottom left panel shows time-space plot (Y axis, time, X axis-space) of impulse propagation (green) along the dotted line shown in the above panel. The right panel shows time plot of action potentials along the green line [56].